In addition to the standard reports available on the default analytics panels such as Company rhythm and My productivity, Uspacy offers a tool to create custom reports.

Yes, this means you can create reports based on the parameters you need.
Please note that the analytics data is cached for a certain period of time. This means that the indicators are updated as follows:
How does it work?
Go to the Analytics section and click on the Reports and Widgets tab. Here click the Create button.
Please note that only the owner and Space administrator have access to create reports.

A form will open where you can configure the parameters of your report, including:
🟣 a tool (entity): Select the data source for your report. For example, you might want to analyze specific indicators in tasks, CRM deals, or your smart object.

🟣 The report name.

🟣 A description: To better explain the purpose of the report.

💡 This field contains a built-in editor that allows you to format the content.

🟣 Filters: Define additional parameters that are necessary for your report.

💡 You can leave this section empty. In that case, the message No filter applied will appear, meaning the report will be based on data from all elements of the selected tool or entity.

💡 When generating a CRM report, you can use UTM tags in the filters to quickly track the effectiveness of different traffic channels and campaigns.
Now, click the Add a condition button.

Then, select the field you want to filter by. It will immediately appear in the block.


You can add multiple conditions.


You can also configure the logic for combining these conditions:

- All conditions at the same time: This option means that the report element must meet all the specified conditions simultaneously. This uses the logical operator “AND”.
- At least one condition: This option means that the report element must meet at least one of the specified conditions. This uses the logical operator “OR”.
🟣 A chart type for your report. There are 7 available types. They differ in how the information is visually represented. The choice of chart type depends on the data you want to analyze and the trends, comparisons, or relationships between them that you want to see visually.

Each chart includes 1 to 2 key indicators, which are placed on the vertical or horizontal axis.
✅ View by: The list of possible indicators depends on the tool or entity for which you are creating the report.

💡 For example, UTM tags are also taken into account when generating CRM reports.
✅Measure by: This is always a numeric indicator, either the number of elements or the sum (if the report is for entities that have sums).
For CRM reports, custom fields such as Money and Number (Integer and Number with fractional part) can be displayed here.
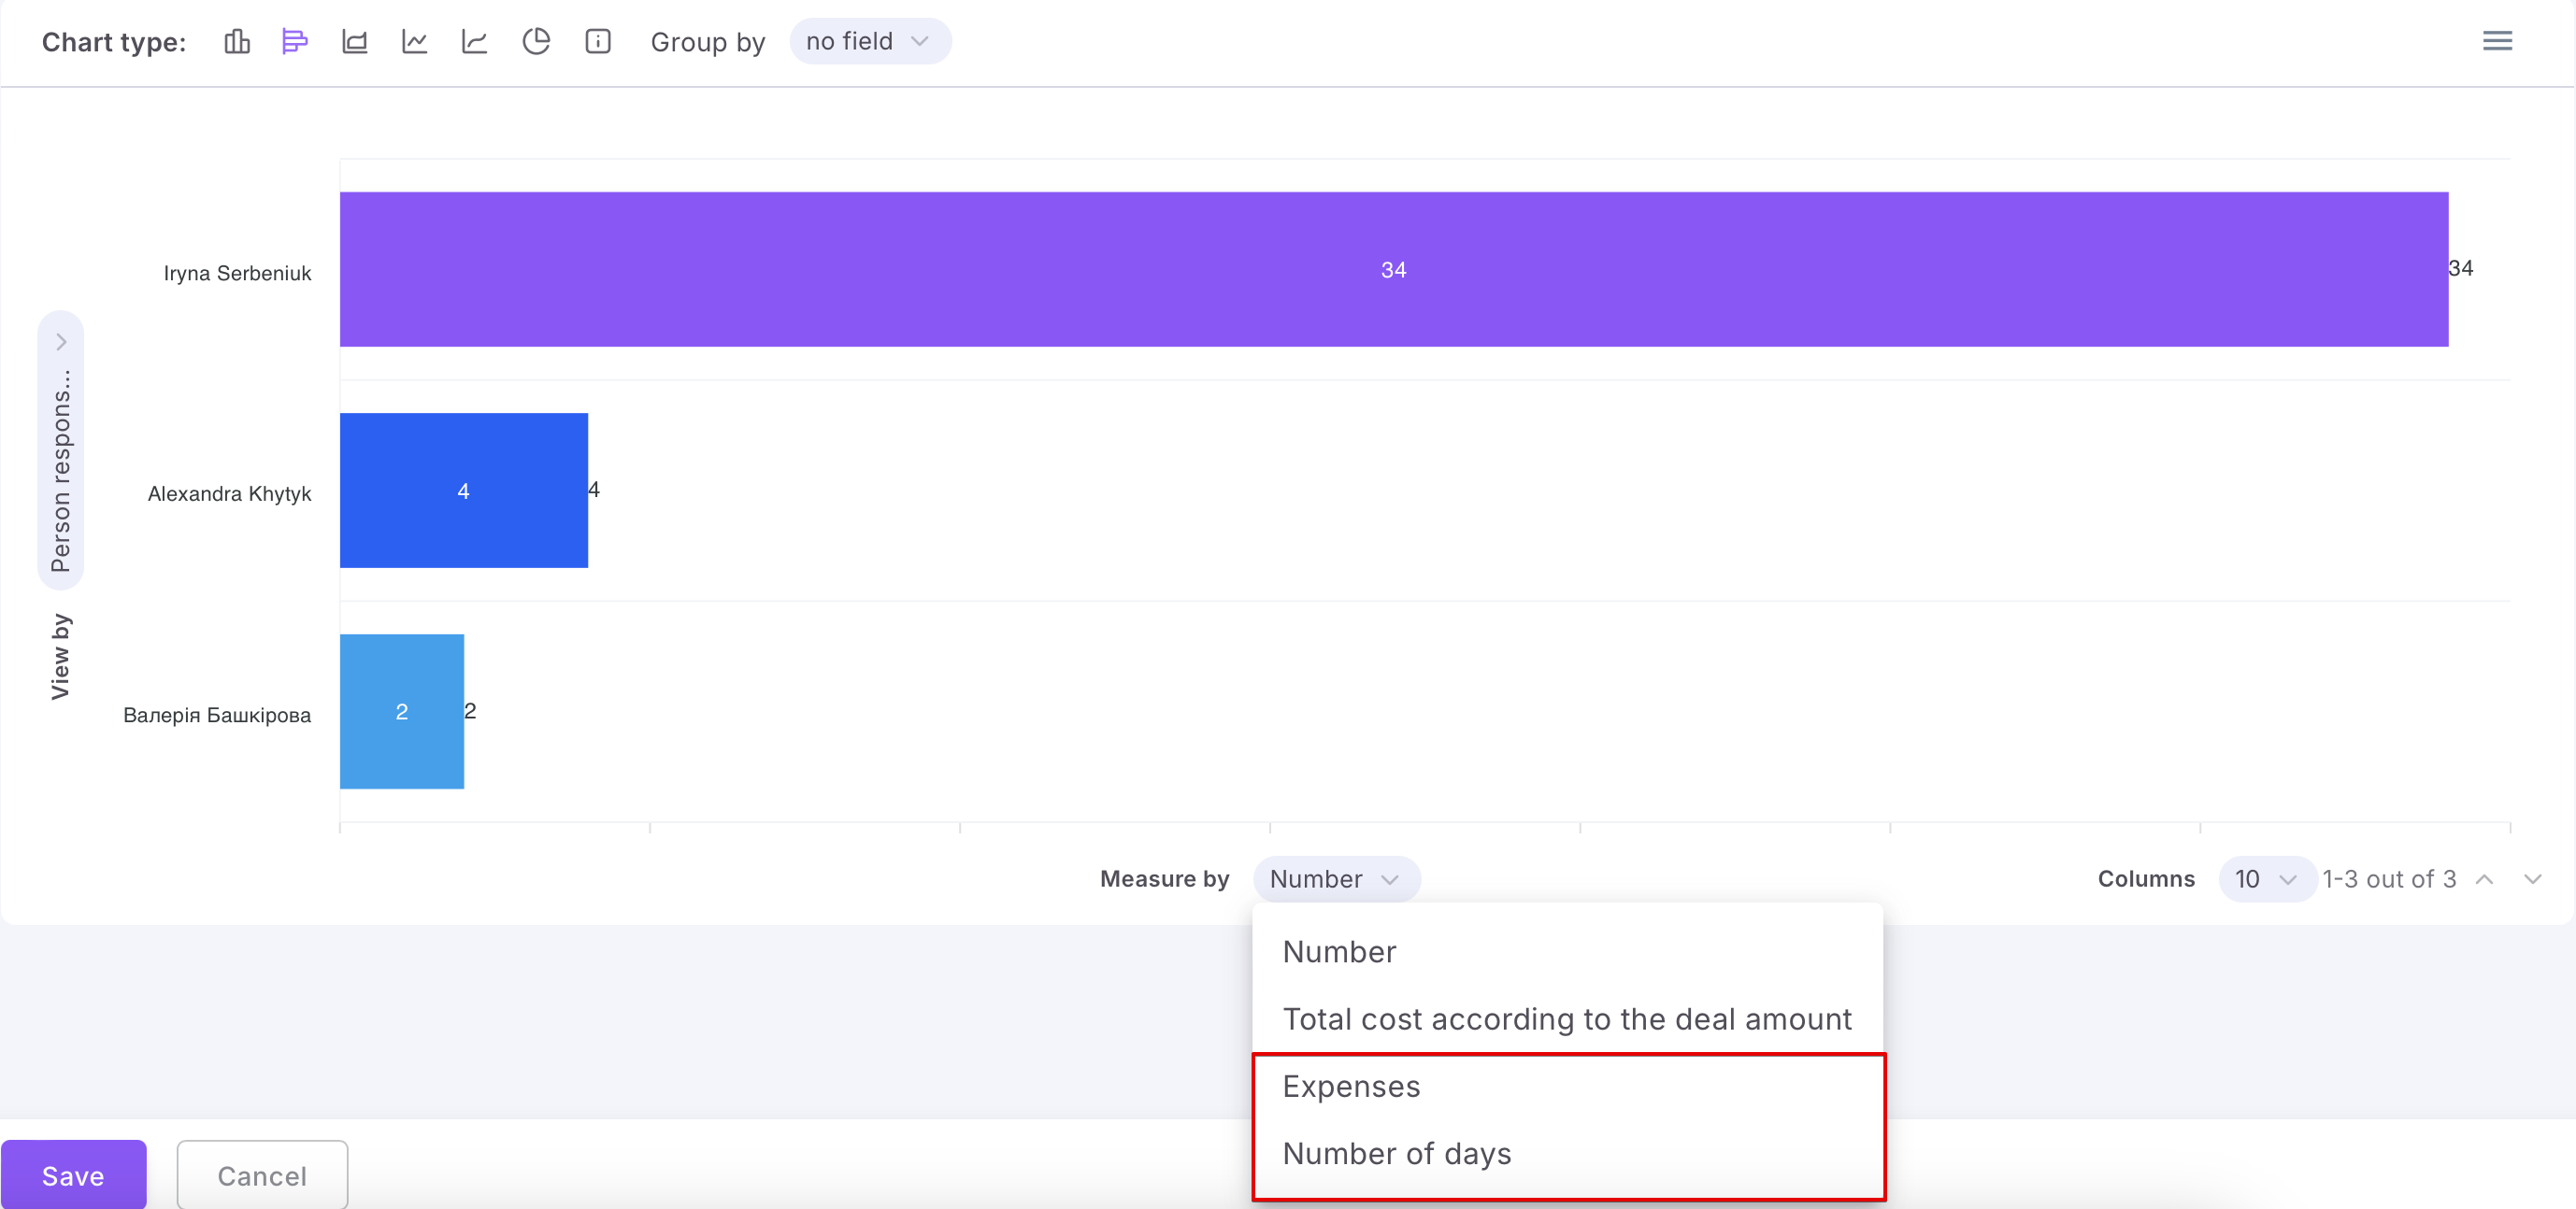
For fields of the Money type, you can select which currency (from those added for use in the system) to display in the report.
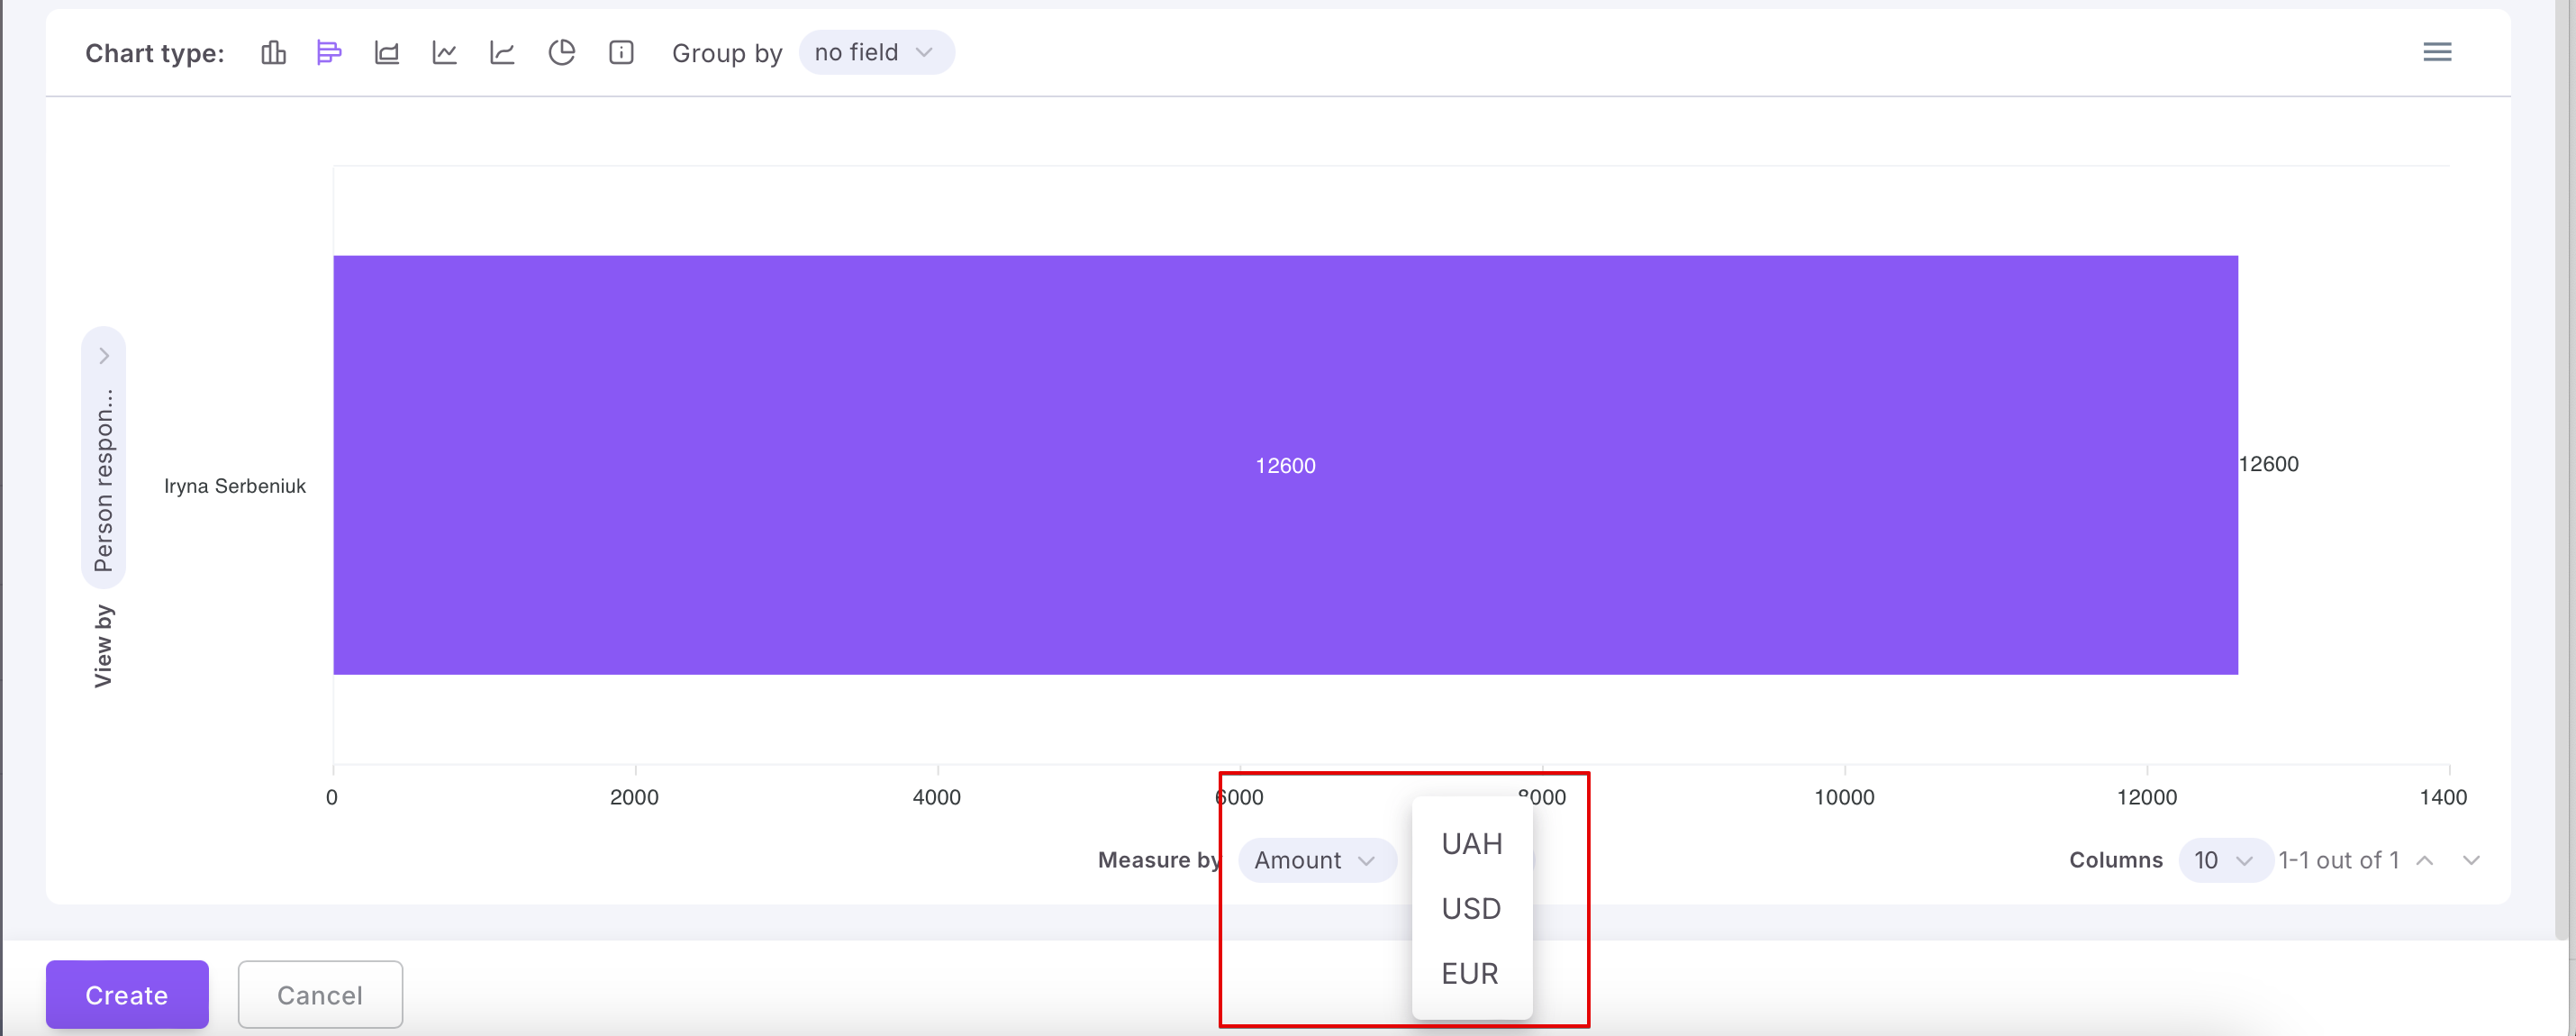

💡 The presence or absence of these indicators depends on the chart type. For example, an Info block chart only has the Measure by indicator, which includes the number(or sum, if the report is created for entities with sums).

Additionally, for some chart types, there is another extra indicator:
✅Group by: This allows you to sort elements based on shared attributes, specific criteria, or categories for better analysis and visualization, which makes the report easier to interpret. This is an additional "breakdown" by groups in the chart, based on the key indicators (on both the horizontal and vertical axes).
💡 When generating CRM reports, you can also group data by UTM tags.

💡 For example, in a Chart, you can display the number of elements or sum (as the main indicator) and group by a certain attribute (as the additional indicator).

Furthermore, for this chart, you can also set appearance parameters, such as the type of chart itself, whether to display numerical values or percentages.

Once the report parameters are set, click Create.

Done!

Where to find your created reports?
All the reports you create are stored in the Reports and Widgets tab.

You can easily edit, delete, or duplicate your report at any time.

Additionally, you can use the search bar (1) and the two built-in quick filters Section (2) and Responsible (3) to find the report you need.

💡 Section refers to the tool or entity for which the report was created. Responsible refers to the user who is the author of the report.
If you have additional questions or you need to contact the support, send a request to this email [email protected]
Created: December 17, 2024 / Updated: December 23, 2025